What makes a delivery shift worth repeating?
The answer depends on the work you want to do. A longer shift may contribute more toward a monthly earnings goal. A shorter shift may use your available time more effectively. Distance and chosen costs can change the comparison again.
A delivery shift log makes those trade-offs visible. Record enough context to distinguish a food delivery lunch session, a parcel route, an evening grocery run, or another kind of delivery work. A useful label tells you what you are comparing when you return weeks later.
Use a consistent set of inputs
For each shift, record date, start time, platform or service label, vehicle, shift label, total work time, active time when available, deliveries, distance, and earnings. Use the same definition of work time across comparable records. Notes can explain unusual delays, route changes, or a one-off bonus.
Choose miles or kilometers and the appropriate workspace currency before entry. If you import a screenshot, check the draft before saving. A screenshot can fill available fields, but a partial trip or activity list may not establish the full session’s hours or earnings.
Compare time, earnings, and distance side by side
Both examples below use USD and the same estimates: $0.20 per mile for operating costs plus $0.10 per mile for maintenance. They are illustrative records entered into the actual Drovm workspace.
| Metric | Lunch route | Evening route |
|---|---|---|
| Gross earnings | $72.00 | $90.00 |
| Total work time | 3h | 4h 30m |
| Active time | 2h | 3h |
| Deliveries | 8 | 10 |
| Distance | 24 mi | 45 mi |
| Estimated distance costs | $7.20 | $13.50 |
| Analysis net earnings | $64.80 | $76.50 |
| Gross per total work hour | $24.00 | $20.00 |
| Gross per active hour | $36.00 | $30.00 |
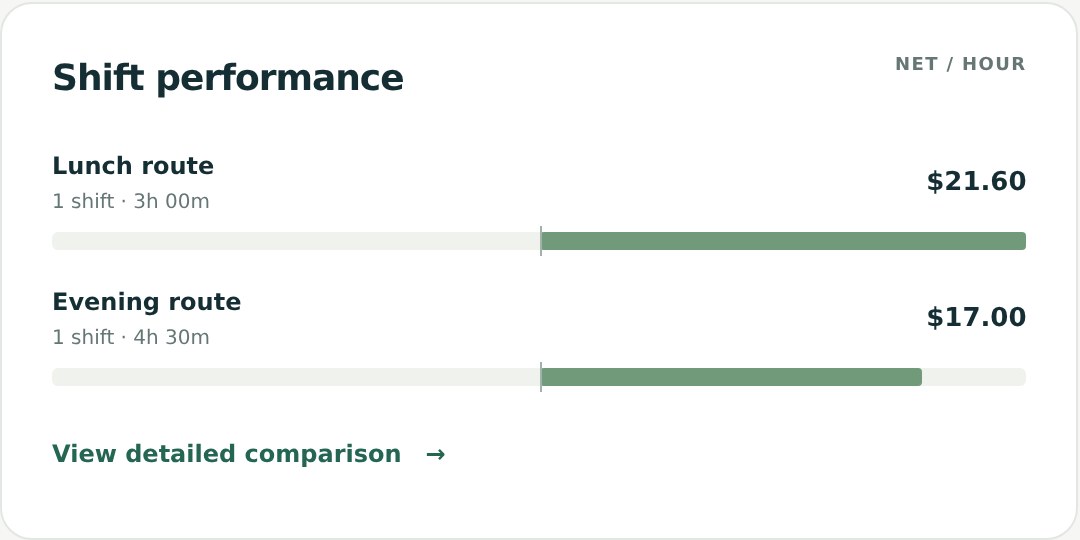
| Net per total work hour | $21.60 | $17.00 |
| Net per active hour | $32.40 | $25.50 |
| Gross per mile | $3.00 | $2.00 |
| Net per mile | $2.70 | $1.70 |
Net per total work hour = (gross earnings − estimated distance costs) ÷ total work hours
To check the lunch route, subtract $7.20 of estimated distance costs from $72 to get $64.80 Analysis net. Divide by 3 total hours for $21.60/hr, by 2 active hours for $32.40/active hr, or by 24 miles for $2.70/mi. Each rate uses the same earnings figure and a different denominator.
Read the comparison in three ways
- Total earnings: the evening route produces $18 more gross and $11.70 more Analysis net. It may contribute more toward a total earnings target.
- Time: the evening route takes 90 minutes longer. The lunch route produces $4.60 more net per total work hour, which matters when available hours are limited.
- Distance: the evening route covers 21 more miles. The lunch route produces $1.00 more net per mile under these cost assumptions.
No single column answers every question. The higher payout and the stronger hourly result belong to different shifts in this example. Neither result establishes which pattern will perform best next time.
Check the basis before ranking results
Drovm Analysis net subtracts distance-based operating and maintenance estimates. It excludes separately logged expenses and tax reserves; Overview handles those for the reporting period. Read the cost calculation guide if you want to reconcile those views.
Total-hour rates use the work time you recorded. Active-hour rates use recorded active time. When multiple platforms overlap, Drovm counts overlapping work intervals once overall and retains each platform’s own hours for platform comparisons. Active durations remain summed, so review overlapping active work before interpreting combined active-hour rates.
Turn one comparison into a useful history
- Start with a question. For example, “Do my lunch routes produce stronger net hourly results than my evening routes?”
- Keep labels consistent. Use the same shift label for work you intend to compare as a group.
- Check the sample. One shift per label demonstrates a calculation. More comparable shifts help reveal whether the difference persists.
- Review the exceptions. A bonus, missing mileage, unusual wait, or different vehicle can explain an apparent winner.
- Follow both rate and total. Use the nine-week trend’s net earnings/hour and total earnings views, then compare progress toward monthly and annual gross goals.
Grouped hourly rates should divide combined earnings by relevant combined hours, rather than average the displayed rates from individual shifts. This keeps longer sessions from being underweighted.
A courier earnings tracker or delivery shift log is most useful when it helps you ask a better next question. Record the next comparable shift, check the values, and see whether the pattern holds. For the time calculation in more detail, read active time vs. total time.