To compare delivery shifts, use final earnings, total work time, distance, and the same cost definitions. Check both the amount left after costs and the amount earned per hour. Then compare several similar sessions to see whether the apparent advantage survives unusual tips, promotions, and delays.
Decide what a better delivery shift means
Choose the question before ranking your records. With limited time, earnings after costs per total work hour may be your main measure. For a weekly income goal, the total amount matters too. Distance helps explain how much vehicle use produced that money.
Compare similar platforms, vehicles, weekdays, areas, and work windows where possible. If you change the platform, vehicle, and hours at once, the records cannot tell you which change explains the result. Delivery work can include food, groceries, parcels, or other routes; use labels that distinguish them.
Record comparable information for each shift
Save the date, start time, platform, vehicle, shift label, work duration, active time when verified, deliveries, distance, earnings, and notes. Keep the same currency and distance unit within each comparison.
Use total work time, including waiting, for the whole-shift hourly rate. Keep personal breaks and gaps between sessions clear. A trip duration is not necessarily a full work session; verify screenshot imports before saving. The active versus total time guide explains the distinction.
Compare two shifts using the same cost basis
These fictional USD records use $0.20 per mile for operating costs and $0.10 per mile for maintenance. The example rates are assumptions, not recommendations. Net below means earnings after those distance estimates, before separately logged expenses and tax reserves.
| Metric | Lunch route | Evening route |
|---|---|---|
| Gross earnings | $72.00 | $90.00 |
| Total work time | 3h | 4h 30m |
| Distance | 24 miles | 45 miles |
| Estimated distance costs | $7.20 | $13.50 |
| Net after distance costs | $64.80 | $76.50 |
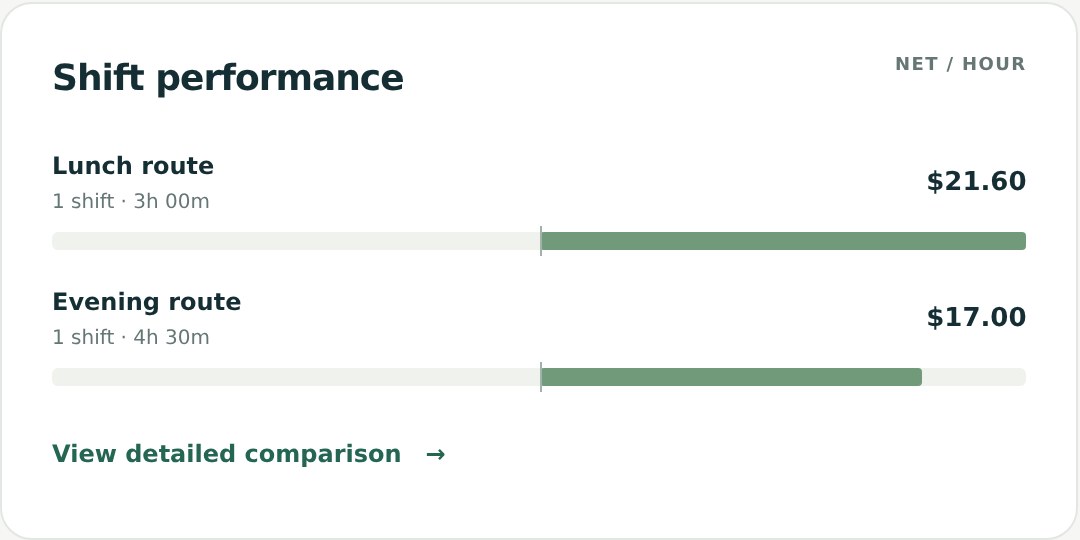
| Net per total work hour | $21.60 | $17.00 |
| Net per mile | $2.70 | $1.70 |
Net per work hour = (earnings − included costs) ÷ total work hours
For lunch, 24 miles at a combined $0.30 per mile costs an estimated $7.20. Subtract that from $72 and divide the remaining $64.80 by three hours to get $21.60 per hour. For the full breakdown of deliveries, active-hour rates, and gross-per-mile measures, see the side-by-side delivery shift metrics guide.
Read the comparison against your goal
Evening produces $11.70 more after the included costs, but requires another 90 minutes and 21 miles. Lunch earns $4.60 more per total work hour and $1.00 more per mile. The stronger hourly result and the larger payout belong to different sessions.
Use active-hour rates as a separate view of delivery activity. They do not include all the time you committed. Neither one sample shift nor a higher utilization percentage establishes which work window will perform better next time.
Compare groups of shifts rather than one standout session
Group records using consistent labels, such as Tuesday lunch and Tuesday evening on the same platform and vehicle. Show the number of shifts and the total hours behind each result. Divide combined net earnings by combined work hours, rather than averaging individual hourly rates.
Here is a separate fictional comparison of repeated sessions. The evening total includes a $36 one-time bonus. The last row tests how much that bonus affected the result while holding recorded hours and costs constant.
| Group or scenario | Net earnings | Work hours | Net per hour |
|---|---|---|---|
| Four lunch shifts | $180.00 | 9h | $20.00 |
| Four evening shifts | $252.00 | 12h | $21.00 |
| Evenings without the $36 bonus | $216.00 | 12h | $18.00 |
Evenings lead by $1 per hour with the bonus but trail by $2 without it. Keep the actual bonus in your saved earnings; the adjusted row is a sensitivity check, not a replacement record or a forecast.
DoorDash’s promotion guidance explains that incentives have conditions and can vary by location, timing, and driver. Check the terms before assuming an unusually strong result will repeat.
Ask how much of the advantage depends on the bonus
At the lunch group’s $20 hourly rate, 12 evening work hours would need $240 net on the same cost basis. Without the bonus, evenings are $24 short of that comparison point: $240 minus $216. The recorded $36 bonus covers that gap and adds $12, which is the $1-per-hour lead across 12 hours. This shows how sensitive the ranking is to the incentive; it does not predict another bonus.
Even without the bonus, evenings produce $36 more total net than lunches, but use three more work hours. If time is limited, the hourly comparison matters; if you need a larger total and can work the extra hours, the total matters too. Do not assume either group’s rate would stay the same if you shortened or extended its shifts.
Review variation and incomplete records
Four shifts per group demonstrate the calculation; they do not prove a lasting pattern. Compare the range of individual results and repeat the review across additional comparable weeks. Note unusual tips, holidays, weather, long waits, or changing delivery types without assuming any one factor caused the outcome.
A group total does not reveal its range: several steady sessions and one exceptional session can produce the same average. Keep the individual records visible before deciding the average represents a dependable work window.
Include verified slow sessions, including work time with zero earnings. Correct missing mileage or hours before ranking results that depend on them. If a cost assumption changes, apply a consistent basis to the comparison and make the change visible.
When multiple apps overlap, count shared work time once for overall results while retaining each platform’s hours for platform comparisons. Accurate recorded work intervals are needed for that correction. Summed active durations do not resolve active overlap automatically; review overlapping active periods before interpreting combined active-hour rates. Time correction also does not deduplicate mileage, expenses, or every imported record. The multi-app earnings guide explains these checks.
Use the comparison to plan your next test
In Drovm, use consistent shift labels and notes, then compare earnings, hours, and distance in Analysis. Its net rates subtract distance-based operating and maintenance estimates; separately logged expenses and tax reserves are excluded. The cost guide explains how to reconcile those measures.
Review both net earnings per hour and total earnings in the nine-week trend. Pick one practical change, such as testing the same evening window again, and record the next comparable session. A useful conclusion states what the records show, how many shifts support it, and what remains uncertain.
For the repeated-shift example, a useful note would be: “Across four shifts each, evenings earned $21 net per hour versus $20 at lunch, but only $18 without the one-time bonus. I will compare another set of similar work windows and record promotions separately in my notes.” Keep the actual pay in each saved record, retain slow sessions, and choose the review period before seeing which shift wins.